What is matplotlib-venn package?
Let me introduce a python package, ‘matplotlib-venn’1 which can create Venn diagram. We sometimes have situations that we need to depict the relationship between multiple sets. Whenever that happens, I used to use web-based tools I can use easily on my web browser. However, the tools have some limitations of customizing so that I had to draw it manually using graphics software like Illustrator.
Unlike the tools I mentioned earlier, ‘matplotlib-venn’ is easy-to-use and offers flexibility to customize all features. In particular, while there has been a small number of packages which can produce area-weighted2 diagram, one of remarkable features in the package is that it can do this.
The package is applicable to use when you have two or three sets.
(If you have more than three sets, I suggest you use more efficient way of plotting venn diagram like ‘upset’)
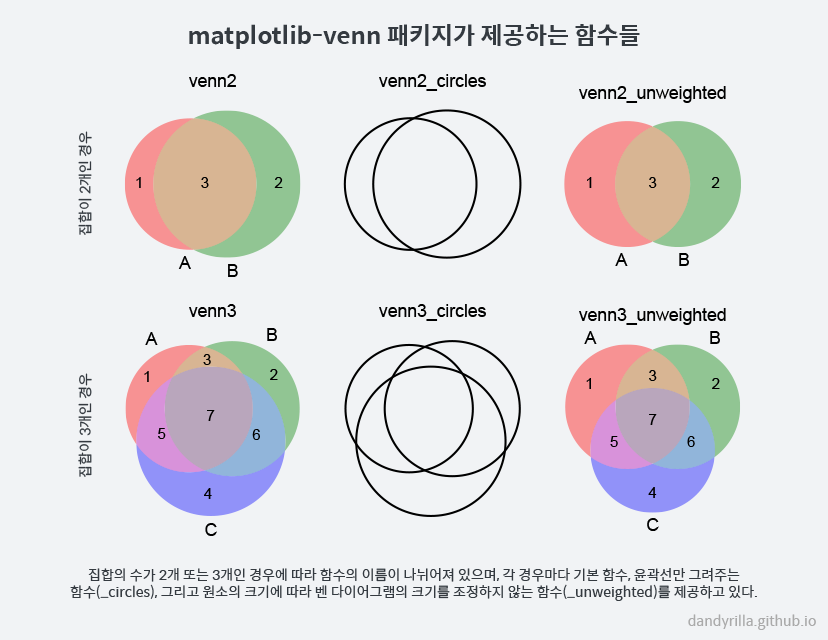
A function you have to use is dependent on the number of sets to compare.
Use the function venn2 for two sets and the function venn3 for three sets.
Beyond these basic functions, it also provides another functions called venn2_circles and venn3_circles, which add only outline of the diagram.
If you don’t mind the size of area, you can use venn2_unweighted and venn3_unweighted, which are not area-weighted functions.
These six are all functions the package provides.

Install the package
여러분이 하고자 하는 기능이 잘 담겨있다고 생각되시나요? 자, 그럼 설치를 한번 해 봅시다. 이 패키지는 matplotlib 이라는 시각화 패키지 위에서 동작하므로 matplotlib 패키지가 먼저 설치되어 있어야 합니다. 하지만 여러분이 패키지를 하나씩 직접 설치하는 경우가 아니라면 이러한 의존성들에 대해서는 패키지 설치 관리자들이 알아서 설치를 해 줄 것이므로 크게 신경 쓸 필요가 없습니다. 파이썬을 사용하는 환경마다 설치 방법은 조금씩 다를 수 있습니다. 먼저 파이썬을 단독으로 설치해서 사용하는 환경의 경우에는 easy_install 을 사용하여 아래와 같이 설치해주면 됩니다.
easy_install matplotlib-venn
그리고 아나콘다 환경에서는 conda install 명령어를 이용하여 설치해주시면 됩니다.
설치 시에 채널을 지정하지 않으면 패키지를 못 찾을 수 있으니
채널을 지정하는 옵션인 -c conda-forge 를 넣어 설치하는 것을 권장합니다.
conda install -c conda-forge matplotlib-venn
설치가 성공적으로 되었다면 아래와 같이 패키지를 불러오는 데 문제가 없어야 합니다. 앞에서 설치하기 위해 패키지 이름을 적어줄 때에는 하이픈(matplotlib-venn)이 쓰였지만, 패키지를 사용하기 위해 파이썬에서 import 할 때에는 언더스코어(matplotlib_venn)를 사용하는 점에 주의합니다.
from matplotlib_venn import venn2
matplotlib-venn 의 기본적인 사용법
가장 기본적인 예제를 통해 사용법을 익혀보도록 하겠습니다.
집합이 2개인 경우에는 venn2 함수를 이용합니다. 이 함수의 첫 인자는 subsets3 인데요.
여기에 각 부분집합의 크기가 들어있는 튜플을 넘겨주면 됩니다.
아래의 코드에서는 (1, 2, 3) 이라는 튜플을 넘겨주어 보았습니다.
집합은 2개인데, 왜 3개의 값을 넘겨주냐고요? 집합의 2개인 경우에 생길 수 있는 부분집합의 수가 3개여서 그렇습니다.
집합 A와 B가 있다고 가정해보면, 집합 A 에만 속하는 집합(A-B), 집합 B 에만 속하는 집합(B-A),
그리고 집합 A 와 B 의 교집합(A∩B)으로 총 3개의 부분집합이 생기게 됩니다.
이 순서대로 부분집합의 크기를 넣어주면 됩니다.
import matplotlib.pyplot as plt
from matplotlib_venn import venn2

venn2(subsets=(1, 2, 3))
plt.show()

-
기존에 매우 다양한 벤 다이어그램을 도구들이 존재했지만 제목이나 강조 표시 하나 손 쉽게 넣을 수 있는 도구는 잘 없는 점에 착안하여 에스토니아 출신 연구자인 Konstantin Tretyakov가 2012년에 만든 파이썬 패키지입니다. (참고: Konstantin 의 블로그: Venn Diagrams in Python) ↩
-
영어로는 이를 area-weighted 라고 표현합니다. ↩
-
반드시 꼭
venn2(subsets=(1, 2, 3))처럼 keyword argument 로 넘겨줄 필요는 없습니다. 간단히venn2((1, 2, 3))처럼 positional arguments 로 넘겨주어도 괜찮습니다. ↩